{var%20f='http://v.t.sina.com.cn/share/share.php?appkey=1515056452',u=z||d.location,p=['&url=',e(u),'&title=',e(t||d.title),'&source=',e(r),'&sourceUrl=',e(l),'&content=',c||'gb2312','&pic=',e(p||'')].join('');function%20a(){if(!window.open([f,p].join(''),'mb',['toolbar=0,status=0,resizable=1,width=440,height=430,left=',(s.width-440)/2,',top=',(s.height-430)/2].join('')))u.href=[f,p].join('');};if(/Firefox/.test(navigator.userAgent))setTimeout(a,0);else%20a();})(screen,document,encodeURIComponent,'','','https://www.xiaopingtou.cn//data/attach/topic/topicKPo7gB.jpg', '推荐 wycong 的文章《绘制logisitc回归的风险预测值的nomogram图》','https://www.xiaopingtou.net/article-51443.html','页面编码gb2312|utf-8默认gb2312'));)
nomogram图,又称列线图,诺模图,可直接用于计算预测的分数
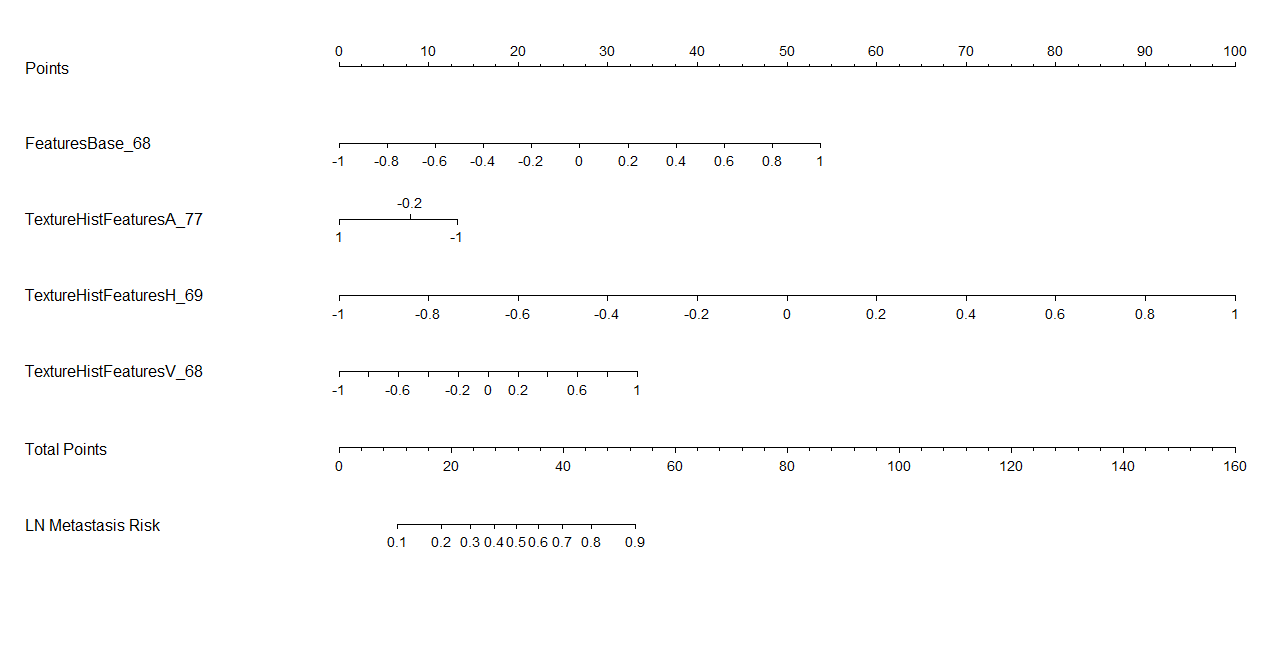 结果如上图所示
参考资料可以去丁香园上找
参考文献:
doi:10.1093/jnci/djv291 Establishment and Validation of Prognostic Nomograms for Endemic Nasopharyngeal Carcinoma
结果如上图所示
参考资料可以去丁香园上找
参考文献:
doi:10.1093/jnci/djv291 Establishment and Validation of Prognostic Nomograms for Endemic Nasopharyngeal Carcinoma
#first need to set path
setwd('E:\Course\cluster') #设置当前工作目录
getwd() #查看当前工作目录
thyroid<- read.table("thyroid.csv",header=FALSE,sep=",") #load

data=thyroid
data=thyroid[,1:10] #太多不拟合


fix(data)
rownames(data)[1]<-"thyroidlabel"

#把1,2的标签换成0 1
for (i in 1:455)
{if(data[i,1]==2)
  data[i,1]=0
}

data=data[,-13]

###标签换成yes no的离散的  但是不好用
if(0){
for (i in 1:455)
{if(data[i,13]==0)
  data[i,13]='no'
else
  data[i,13]='yes'
}}
###

library(rms)

## 第三步 按照nomogram要求“打包”数据,绘制nomogram的关键步骤,??datadist查看详细说明
ddist <- datadist(data)
options(datadist="ddist")

## 第四步 构建模型
## 构建logisitc回归模型
mod <- lrm(data$thyroidlabel~.,data = data)
mod <- glm(data$thyroidlabel ~.,family=binomial(link = "logit"),data = data)

## 绘制logisitc回归的风险预测值的nomogram图
nom <- nomogram(f1, fun= function(x)1/(1+exp(-x)), # or fun=plogis
                lp=F, funlabel="LN Metastasis Risk")
plot(nom)

nom <- nomogram(mod,
                lp=T,
                lp.at = seq(-5,5,by=0.5),
                fun=function(x) 1/(1+exp(-x)),
                funlabel = 'Risk of metastasis',
                fun.at = c(0.05,seq(0.1,0.9,by=0.1),0.95),
                conf.int = c(0.1,0.7))

plot(nom,
     lplabel = 'Linear Predictor',
     fun.side = c(1,1,1,1,3,1,3,1,1,1,1),
     label.every = 3,
     col.conf = c('blue','green'),
     conf.space = c(0.1,0.5),
     col.grid = gray(c(0.8,0.95)),
     which='shock')
结果如上图所示
参考资料可以去丁香园上找
参考文献:
doi:10.1093/jnci/djv291 Establishment and Validation of Prognostic Nomograms for Endemic Nasopharyngeal Carcinoma